Multiple Choice
The figure given below represents the equilibrium real GDP and price level in the aggregate demand and aggregate supply model. Figure 8.3 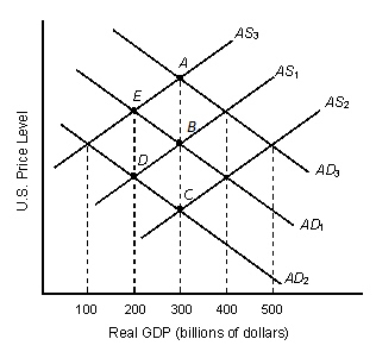 Refer to Figure 8.3.If AS1 and AD1 represent the initial aggregate demand and supply in the economy, the long-run equilibrium real GDP will be _____ billion.
A) $100
B) $200
C) $300
D) $400
E) $500
Correct Answer:

Verified
Correct Answer:
Verified
Q15: What happens to aggregate supply when production
Q16: The aggregate quantity of goods and services
Q17: The long-run aggregate supply of an economy
Q18: Lower interest rates on business loans usually
Q19: Which of the following is not held
Q21: The fact that the aggregate demand curve
Q22: Identify the correct statement about the aggregate
Q23: The table given below reports the average
Q24: Other things held constant, when the general
Q25: Each of the panels given below represents