Multiple Choice
The figure given below represents the equilibrium price and output in the market for restaurant meals and delivery meals. Figure 4.1 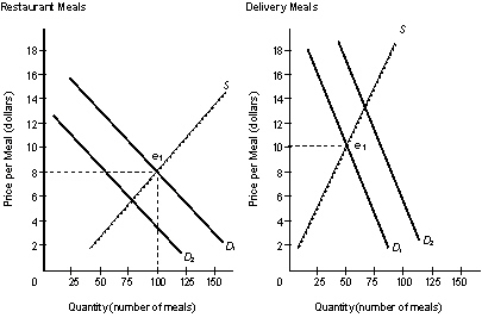 Refer to Figure 4.1.Which of the following is represented by this figure?
A) Delivery meals and restaurant meals are complementary goods.
B) When producers of delivery and restaurant meals change their preferences, the consumers respond.
C) The increase in demand for delivery meals could have been caused by a change in consumers' tastes.
D) The fall in demand for restaurant meals was caused by an increase in the price for restaurant meals.
E) The demand for delivery meals is less elastic than that for restaurant meals.
Correct Answer:

Verified
Correct Answer:
Verified
Q12: The figure given below represents the circular
Q22: When a household owns shares of stock,
Q30: Which of the following situations is an
Q47: Scenario 4-1<br>In a given year, country A
Q49: Scenario 4-1<br>In a given year, country A
Q51: Which of the following sectors in the
Q54: Scenario 4-1<br>In a given year, country A
Q61: Firms try to minimize costs and maximize
Q77: Since the U.S.is organized as a market
Q93: In the market for digital photo frames,any