Multiple Choice
The figure given below represents the circular flow of income between households, firms, financial intermediaries, and foreign countries. Figure 4.2 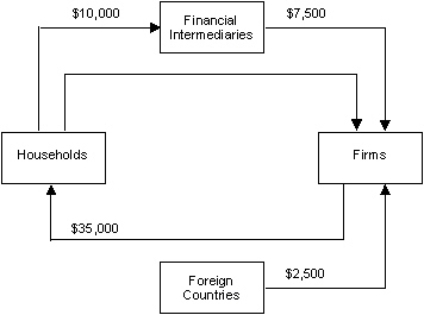 Refer to Figure 4.2.Calculate the total amount of consumption expenditure.
A) $7, 500
B) $25, 000
C) $10, 000
D) $42, 500
E) $35, 000
Correct Answer:

Verified
Correct Answer:
Verified
Q8: The figure given below represents the equilibrium
Q14: The figure given below represents the equilibrium
Q22: When a household owns shares of stock,
Q30: Which of the following situations is an
Q47: Scenario 4-1<br>In a given year, country A
Q51: Which of the following sectors in the
Q54: Scenario 4-1<br>In a given year, country A
Q77: Since the U.S.is organized as a market
Q93: In the market for digital photo frames,any
Q100: 'Walkmans' that played audio cassettes were withdrawn