Multiple Choice
The figure given below represents the equilibrium price and output in the market for restaurant meals and delivery meals. Figure 4.1 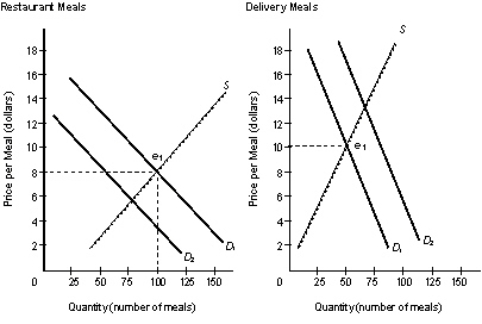 Refer to Figure 4.1.The demand for Restaurant Meals shift in one direction while the demand for Delivery meals shift in another direction.This implies:
A) the demand for Restaurant Meals increased while that for Delivery Meals decreased.
B) the demand for Restaurant Meals decreased while that for Delivery Meals increased.
C) the demand for Restaurant Meals increased while that for Delivery Meals increased.
D) the demand for Restaurant Meals decreased while that for Delivery Meals decreased.
E) the demand for Restaurant Meals and the demand for Delivery Meals adds up to 1.
Correct Answer:

Verified
Correct Answer:
Verified
Q12: The figure given below represents the circular
Q22: When a household owns shares of stock,
Q23: The public sector of the U.S.economy includes:<br>A)the
Q33: Scenario 4-1<br>In a given year, country A
Q47: Scenario 4-1<br>In a given year, country A
Q49: Identify the correct reason behind the rise
Q51: Which of the following sectors in the
Q75: Which of the following correctly describes the
Q93: In the market for digital photo frames,any
Q100: 'Walkmans' that played audio cassettes were withdrawn