Essay
(A)Summarize the findings of the stepwise regression method using this cutoff value.
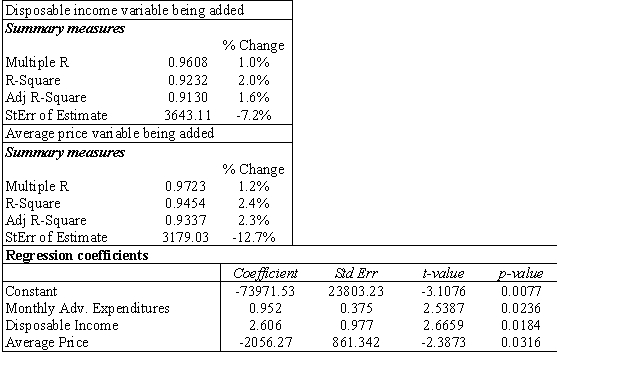
(B)When the cutoff value was increased to 0.10,the output below was the result.The table at top left represents the change when the disposable income variable is added to the model and the table at top right represents the average price variable being added.The regression model with both added variables is shown in the bottom table.Summarize the results for this model.
 (C)Which model would you recommend using? Why?
Correct Answer:

Verified
(A)When a cutoff value of 0.05 is used,t...View Answer
Unlock this answer now
Get Access to more Verified Answers free of charge
Correct Answer:
Verified
View Answer
Unlock this answer now
Get Access to more Verified Answers free of charge
Q1: A confidence interval constructed around a point
Q12: Suppose you forecast the values of all
Q18: A multiple regression model involves 40 observations
Q29: The ANOVA table splits the total variation
Q31: In regression analysis,the ANOVA table analyzes:<br>A) the
Q39: In simple linear regression,if the error variable
Q47: The t-value for testing <img src="https://d2lvgg3v3hfg70.cloudfront.net/TB2053/.jpg" alt="The
Q53: Suppose that one equation has 3 explanatory
Q59: The information below represents the relationship between
Q60: When determining whether to include or exclude