Multiple Choice
Imagine we were interested in the effect of supporters singing on the number of goals scored by soccer teams. We took 10 groups of supporters of 10 different soccer teams and asked them to attend three home games, one at which they were instructed to sing in support of their team (e.g., 'Come on, you Reds!') , one at which they were instructed to sing negative songs towards the opposition (e.g., 'You're getting sacked in the morning!') and one at which they were instructed to sit quietly. The order of chanting was counterbalanced across groups.
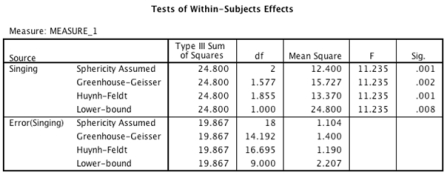
-An ANOVA with a simple contrasts using the last category as a reference was conducted. Looking at the output tables below, which of the following sentences regarding the contrasts is correct? 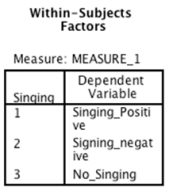
 Tests of Within-Subjects Contrasts
Measure: MEASURE_1
A) The first contrast revealed that soccer teams scored significantly fewer goals when their supporters did not sing compared to when they sang negative songs.The second contrast revealed that soccer teams scored a similar amount of goals when their supporters sang positive songs compared to when they did not sing.
B) The first contrast revealed that soccer teams scored significantly more goals when their supporters sang positive songs compared to when they did not sing.The second contrast revealed that soccer teams scored significantly fewer goals when their supporters sang negative songs compared to when they did not sing.
C) The first contrast revealed that soccer teams scored significantly more goals when their supporters sang positive songs compared to when they did not sing.The second contrast revealed that soccer teams scored significantly fewer goals when their supporters sang negative songs compared to when they sang positive songs.
D) The first contrast revealed that soccer teams scored significantly more goals when their supporters sang positive songs compared to when they did not sing.The second contrast revealed that soccer teams did not significantly differ in the number of goals scored when their supporters sang negative songs compared to when they did not sing.
Correct Answer:

Verified
Correct Answer:
Verified
Q5: Which of the following is a means
Q6: What is the consequence of violating the
Q7: When an experimental manipulation is carried out
Q8: Which of these are potential sources of
Q9: What is Repeated-measures factorial design?<br>A)An experiment, which
Q11: Departures from sphericity can be measured using:<br>A)Neither
Q12: Imagine we were interested in the
Q13: Imagine we were trying to interpret the
Q14: Which of the following regarding the assumption
Q15: Imagine I ran a one-way repeated-measures ANOVA