Multiple Choice
What does the graph below show? 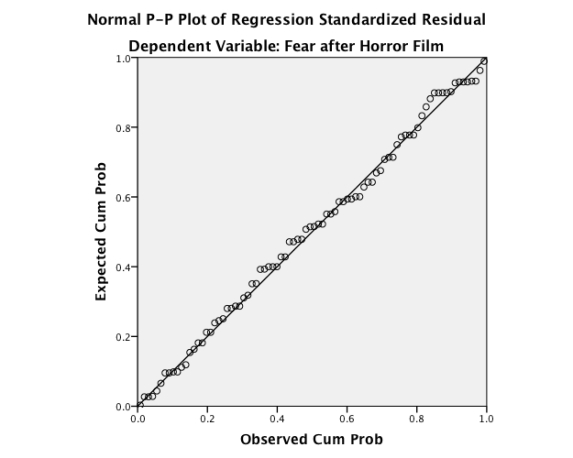
A) Linearity
B) Homoscedasticity
C) Multicollinearity
D) Normality of residuals
Correct Answer:

Verified
Correct Answer:
Verified
Related Questions
Q1: A medical researcher was interested in examining
Q2: A consumer researcher was interested in
Q4: The following graph shows: <img src="https://d2lvgg3v3hfg70.cloudfront.net/TB6538/.jpg" alt="The
Q5: Which of the following is a means
Q6: A psychologist was interested in whether the
Q7: Why is multicollinearity a potential problem in
Q8: Recent research has shown that lecturers are
Q9: Which of the following statements about the
Q10: A psychologist was interested in whether
Q11: Recent research has shown that lecturers are