Multiple Choice
The following graph shows: 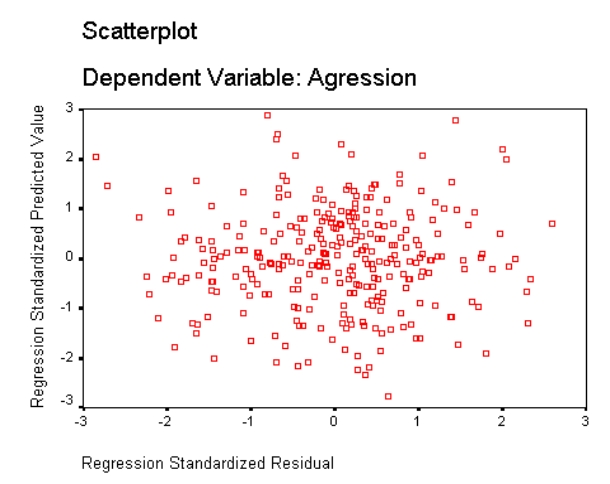
A) Heteroscedasticity.
B) Regression assumptions that have been met
C) Non-linearity
D) Heteroscedasticity and non-linearity
Correct Answer:

Verified
Correct Answer:
Verified
Related Questions
Q1: A medical researcher was interested in examining
Q2: A consumer researcher was interested in
Q3: What does the graph below show? <img
Q5: Which of the following is a means
Q6: A psychologist was interested in whether the
Q7: Why is multicollinearity a potential problem in
Q8: Recent research has shown that lecturers are
Q9: Which of the following statements about the
Q10: A psychologist was interested in whether
Q11: Recent research has shown that lecturers are