Multiple Choice
What type of graph is shown below? 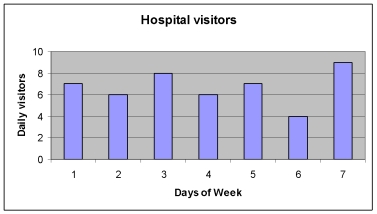
A) Frequency polygon
B) Stacked histogram
C) Simple histogram
D) Frequency distribution
Correct Answer:

Verified
Correct Answer:
Verified
Related Questions
Q2: What conclusion can be drawn from the
Q3: For which of the following sets of
Q4: I collected some data about how much
Q5: What does the information in the following
Q6: The following figure is drawn from Schoenborn,
Q8: What does this graph tell you about
Q9: Which of the following is not recommended
Q10: What conclusion can be drawn from the
Q11: What statement best describes what is shown
Q15: Which of the following does a box-whisker