Multiple Choice
What statement best describes what is shown in the graph below? 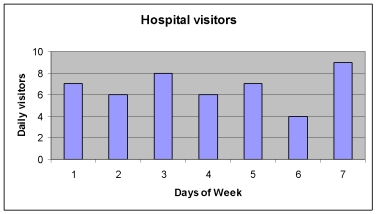
A) There were 46 hospital visitors visiting during the week.
B) There were 48 visitors to the hospital in a week.
C) Day 1 is the most popular day for visiting.
D) Day 6 has the least number of visitors.
Correct Answer:

Verified
Correct Answer:
Verified
Related Questions
Q2: What conclusion can be drawn from the
Q3: For which of the following sets of
Q4: I collected some data about how much
Q5: What does the information in the following
Q6: The following figure is drawn from Schoenborn,
Q7: What type of graph is shown below?
Q8: What does this graph tell you about
Q9: Which of the following is not recommended
Q10: What conclusion can be drawn from the
Q15: Which of the following does a box-whisker