Multiple Choice
Looking at the distribution of data on the bar chart below, how best can it be described? 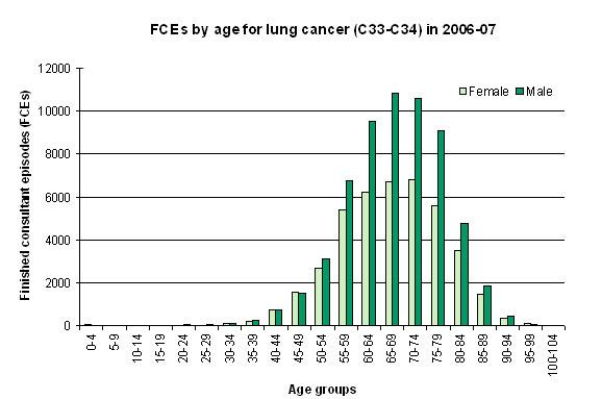
A) Normally distributed
B) Negatively skewed
C) Positively skewed
D) Leptokurtic
Correct Answer:

Verified
Correct Answer:
Verified
Q1: To answer this question visit HYPERLINK "http://www.performance.doh.gov.uk/hospitalactivity/data_requests/download/total_time_ae/ae_08_q4_pt3.xls"
Q2: What does the data in the chart
Q3: To answer this question visit HYPERLINK "http://www.performance.doh.gov.uk/hospitalactivity/data_requests/download/total_time_ae/ae_08_q4_pt3.xls"
Q5: Quantitative research involves the use of which
Q6: To answer this question visit HYPERLINK "http://www.performance.doh.gov.uk/hospitalactivity/data_requests/download/total_time_ae/ae_08_q4_pt3.xls"
Q7: Based on the following chart, the statement
Q8: To answer this question visit HYPERLINK "http://www.performance.doh.gov.uk/hospitalactivity/data_requests/download/total_time_ae/ae_08_q4_pt3.xls"
Q9: The research process is comprised of five