Multiple Choice
What does the data in the chart demonstrate? 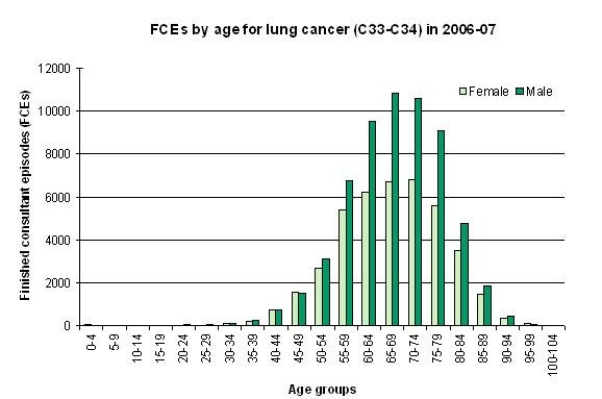
A) The incidence of cancer is highest among women aged 55-59.
B) The incidence of childhood cancer is highest in girls.
C) Cancer affects everyone.
D) A higher incidence of cancer occurs in men across most age groups.
Correct Answer:

Verified
Correct Answer:
Verified
Q1: To answer this question visit HYPERLINK "http://www.performance.doh.gov.uk/hospitalactivity/data_requests/download/total_time_ae/ae_08_q4_pt3.xls"
Q3: To answer this question visit HYPERLINK "http://www.performance.doh.gov.uk/hospitalactivity/data_requests/download/total_time_ae/ae_08_q4_pt3.xls"
Q4: Looking at the distribution of data on
Q5: Quantitative research involves the use of which
Q6: To answer this question visit HYPERLINK "http://www.performance.doh.gov.uk/hospitalactivity/data_requests/download/total_time_ae/ae_08_q4_pt3.xls"
Q7: Based on the following chart, the statement
Q8: To answer this question visit HYPERLINK "http://www.performance.doh.gov.uk/hospitalactivity/data_requests/download/total_time_ae/ae_08_q4_pt3.xls"
Q9: The research process is comprised of five