Multiple Choice
The graph shown plots average ocean temperature, with two different estimates, using different methods. What has been the long-term trend over time? 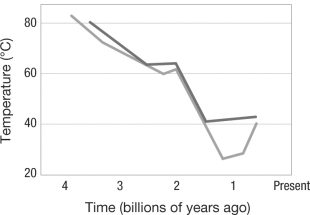
A) Ocean temperature has stayed the same since Earth formed.
B) Ocean temperature has increased since Earth formed.
C) Ocean temperature has fluctuated wildly, and no discernable trend can be found.
D) Ocean temperature has decreased since Earth formed.
Correct Answer:

Verified
Correct Answer:
Verified
Q40: To understand minimal gene sets, Csaba Pal
Q41: The Miller-Urey experiment is significant because it
Q42: Which of the following is NOT a
Q43: Sol Spiegelman and colleagues demonstrated natural selection
Q44: Encapsulation of a hypercycle would NOT be
Q45: Ribozymes are<br>A) RNA enzymes.<br>B) proteins.<br>C) capable of
Q46: How has the role of horizontal gene
Q47: What did Carl Woese hypothesize about early
Q48: Which letter indicates where LUCA is found
Q49: What is the evolutionary relationship between mutation