Multiple Choice
The figure shows the number of days to first flowering in populations of mustard plants before the 2000-2004 drought (on the left, in pale gray) , after the drought (on the far right, in dark gray) , and of hybrids between the before-and-after populations. According to this figure, which of the following statements is true? 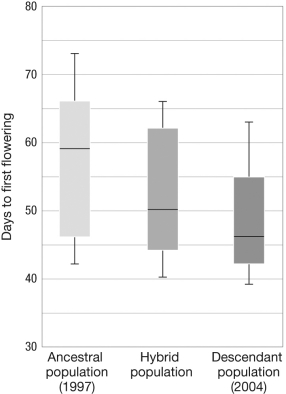
A) After the drought, plants flowered earlier in the season than those from before the drought.
B) After the drought, plants flowered later in the season than those from before the drought.
C) Hybrid plants flowered later in the season than those from before the drought.
D) There was no change in flowering time associated with the drought.
Correct Answer:

Verified
Correct Answer:
Verified
Q12: In a study of life history evolution
Q13: In guppy populations that experience low predation
Q14: What is meant by the statement "Natural
Q15: A trait that serves one purpose today
Q16: To test the hypothesis that natural selection
Q18: The figure shows the relationships between oldfield
Q19: Your text describes two possible explanations for
Q20: The figure shows the norm of reaction
Q21: Based on the figure, use phylogenetic reasoning
Q22: Imagine you are an evolutionary biologist studying