Multiple Choice
The figure shows the relationships between oldfield mice populations. Light-colored beach populations are shown with a triangle; dark-colored inland populations are shown with circles. Which of the following statements is consistent with this phylogeny? 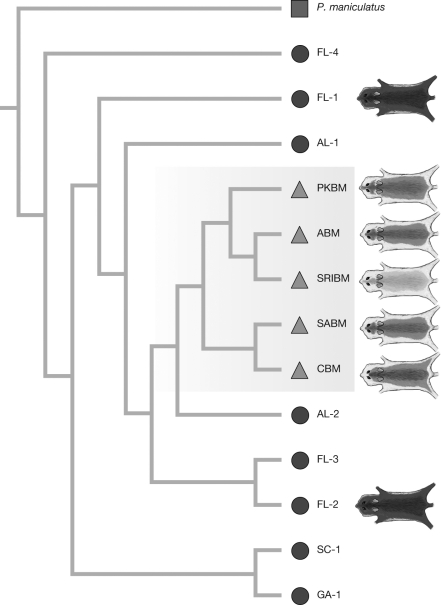
A) Light coat color arose multiple times independently in different beach populations.
B) The light-coat allele arose prior to colonization of beach populations.
C) Natural selection favors light coat color when the Mc1R allele is mutated.
D) Dark-colored populations are derived from migrants from the beach populations.
Correct Answer:

Verified
Correct Answer:
Verified
Q13: In guppy populations that experience low predation
Q14: What is meant by the statement "Natural
Q15: A trait that serves one purpose today
Q16: To test the hypothesis that natural selection
Q17: The figure shows the number of days
Q19: Your text describes two possible explanations for
Q20: The figure shows the norm of reaction
Q21: Based on the figure, use phylogenetic reasoning
Q22: Imagine you are an evolutionary biologist studying
Q23: Give an example of a trait that