Multiple Choice
The figure shows a normal N(400,23) distribution.Find the approximate shaded area. 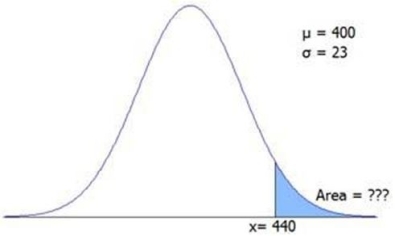
A) 0.0410
B) 0.0501
C) 0.0724
D) 0.0838
Correct Answer:

Verified
Correct Answer:
Verified
Related Questions
Q23: The exponential distribution describes the number of
Q25: The MPG (miles per gallon) for a
Q54: The lengths of brook trout caught in
Q55: Exam scores were normal in BIO 200.Jason's
Q56: On average,a major earthquake (Richter scale 6.0
Q57: The figure shows a normal N(400,23)distribution.Find the
Q62: For Gardyloo Manufacturing,the true proportion of accounts
Q63: The area under the normal curve between
Q64: In Melanie's Styling Salon,the time to complete
Q76: The area under an exponential curve can