Multiple Choice
The figure shows a normal N(400,23) distribution.Find the x value for the shaded area. 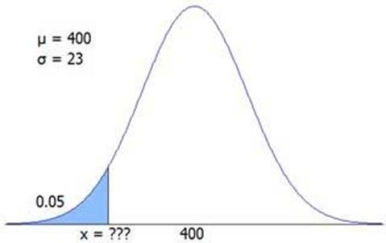
A) 379.1
B) 362.2
C) 355.7
D) 347.6
Correct Answer:

Verified
Correct Answer:
Verified
Related Questions
Q23: The exponential distribution describes the number of
Q24: Assume that X is normally distributed with
Q25: The MPG (miles per gallon) for a
Q54: The lengths of brook trout caught in
Q55: Exam scores were normal in BIO 200.Jason's
Q56: On average,a major earthquake (Richter scale 6.0
Q59: The figure shows a normal N(400,23)distribution.Find the
Q62: For Gardyloo Manufacturing,the true proportion of accounts
Q68: A continuous uniform distribution U(100, 200) will
Q76: The area under an exponential curve can