Multiple Choice
Figure 8-2
The vertical distance between points A and B represents a tax in the market. 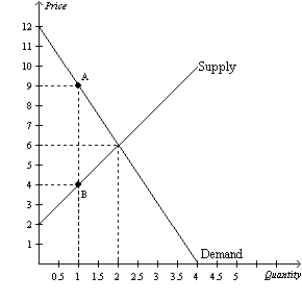
-Refer to Figure 8-2. The loss of producer surplus as a result of the tax is
A) $1.
B) $2.
C) $3.
D) $4.
Correct Answer:

Verified
Correct Answer:
Verified
Q7: Figure 8-9<br>The vertical distance between points A
Q11: Assume the supply curve for cigars is
Q19: Which of the following events always would
Q47: Taxes cause deadweight losses because taxes<br>A)reduce the
Q62: If the tax on a good is
Q69: When demand is relatively elastic, the deadweight
Q109: To fully understand how taxes affect economic
Q140: Figure 8-10 <img src="https://d2lvgg3v3hfg70.cloudfront.net/TB2297/.jpg" alt="Figure 8-10
Q207: Figure 8-1 <img src="https://d2lvgg3v3hfg70.cloudfront.net/TB2297/.jpg" alt="Figure 8-1
Q311: Scenario 8-3<br>Suppose the market demand and market