Multiple Choice
Figure 8-21 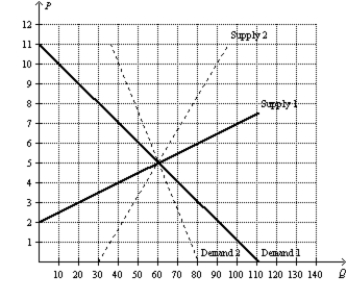
-Refer to Figure 8-21.Suppose the market is represented by Demand 1 and Supply 1.At first the government places a $3 per-unit tax on this good.Then the government decides to raise the tax to $6 per unit.How would you characterize the decision to raise the tax rate from $3 to $6 per unit? The decision is
A) a good one because it increases tax revenue while decreasing the deadweight loss from the tax.
B) a bad one because it does not increase tax revenue yet increases the deadweight loss from the tax.
C) a bad one because it decreases tax revenue while increasing the deadweight loss from the tax.
D) unclear because it increases tax revenue yet also increases the deadweight loss from the tax.
Correct Answer:

Verified
Correct Answer:
Verified
Q26: Figure 8-20<br>On the vertical axis of each
Q27: The graph that represents the amount of
Q28: Figure 8-22 <img src="https://d2lvgg3v3hfg70.cloudfront.net/TB2297/.jpg" alt="Figure 8-22
Q29: Which of the following events is consistent
Q30: With linear demand and supply curves in
Q32: Which of the following scenarios is consistent
Q33: In which of the following instances would
Q34: As the tax on a good increases
Q35: The view held by Arthur Laffer and
Q36: Which of the following scenarios is not