Multiple Choice
The following diagram shows two budget lines: A and B. 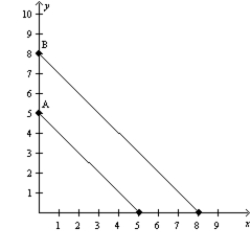 Which of the following could explain the change in the budget line from A to B?
A) a simultaneous decrease in the price of X and the price of Y
B) an increase in income
C) a decrease in income and a decrease in the price of Y
D) Both a and b are correct.
Correct Answer:

Verified
Correct Answer:
Verified
Q8: Suppose that you have $100 today and
Q18: Figure 21-5<br>(a) (b) <img src="https://d2lvgg3v3hfg70.cloudfront.net/TB2179/.jpg" alt="Figure 21-5
Q19: The relationship between the marginal utility that
Q20: The following diagram shows two budget lines:
Q78: What is significant about a point on
Q114: You can think of an indifference curve
Q235: Figure 21-24 The figure shows three indifference
Q523: Energy drinks and granola bars are normal
Q538: If Suzette responds to an increase in
Q567: Pepsi and pizza are normal goods. When