Multiple Choice
The following diagram shows two budget lines: A and B. 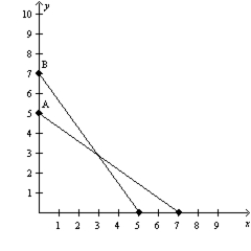 Which of the following could explain the change in the budget line from A to B?
A) a decrease in income and a decrease in the price of X
B) a decrease in income and an increase in the price of X
C) an increase in income and a decrease in the price of X
D) an increase in income and an increase in the price of X
Correct Answer:

Verified
Correct Answer:
Verified
Q11: Consider a consumer who purchases two goods,
Q15: The following diagram shows two budget lines:
Q18: Figure 21-5<br>(a) (b) <img src="https://d2lvgg3v3hfg70.cloudfront.net/TB2179/.jpg" alt="Figure 21-5
Q19: The relationship between the marginal utility that
Q22: The consumer's optimum is where<br>A) MUx/MUy =
Q114: You can think of an indifference curve
Q178: If the consumer's income and all prices
Q459: Consider the budget constraint between "spending today"
Q503: When Jamar has an income of $2,000,
Q523: Energy drinks and granola bars are normal