Multiple Choice
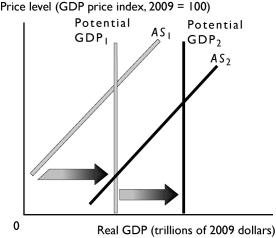
-The change in potential real GDP and aggregate supply shown in the graph above can be a result of
A) an increase in the real wage rate.
B) an increase in the quantity of capital.
C) a decrease in the money wage rate.
D) a decrease in the money price of oil.
E) a fall in the price level.
Correct Answer:

Verified
Correct Answer:
Verified
Q206: _ decreases aggregate supply.<br>A)An increase in potential
Q207: Moving along the aggregate supply curve,<br>A)the quantity
Q208: Which of the following does NOT shift
Q209: Stagflation is defined as a period when
Q210: Initially,demand-pull inflation will<br>A)increase the price level and
Q212: Which of the following changes aggregate supply
Q213: <img src="https://d2lvgg3v3hfg70.cloudfront.net/TB1457/.jpg" alt=" -In the figure
Q214: <img src="https://d2lvgg3v3hfg70.cloudfront.net/TB1457/.jpg" alt=" The figure above
Q215: <img src="https://d2lvgg3v3hfg70.cloudfront.net/TB1457/.jpg" alt=" The table gives
Q216: A macroeconomic equilibrium occurs when the<br>A)quantity of