Multiple Choice
 The figure above shows aggregate demand curves.
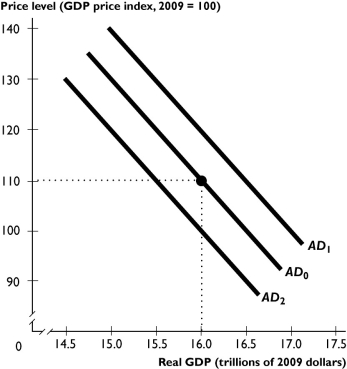
-Based on the figure above,the aggregate demand curve will shift from AD0 to AD2 when
A) potential GDP increases.
B) the price level falls.
C) the price level rises.
D) government expenditure decreases.
E) the Federal Reserve lowers the interest rate.
Correct Answer:

Verified
Correct Answer:
Verified
Q209: Stagflation is defined as a period when
Q210: Initially,demand-pull inflation will<br>A)increase the price level and
Q211: <img src="https://d2lvgg3v3hfg70.cloudfront.net/TB1457/.jpg" alt=" -The change in
Q212: Which of the following changes aggregate supply
Q213: <img src="https://d2lvgg3v3hfg70.cloudfront.net/TB1457/.jpg" alt=" -In the figure
Q215: <img src="https://d2lvgg3v3hfg70.cloudfront.net/TB1457/.jpg" alt=" The table gives
Q216: A macroeconomic equilibrium occurs when the<br>A)quantity of
Q217: Along the aggregate supply curve,the quantity of
Q218: An economy experiences a recessionary gap.As the
Q219: What are the two channels through which