Multiple Choice
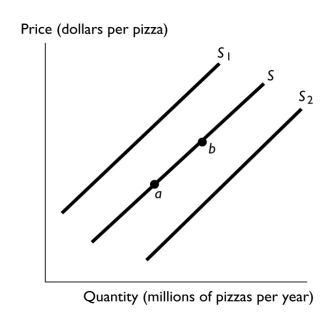
-In the above figure,the shift in the supply curve from S to S2 reflects
A) an increase in the quantity of pizza supplied.
B) a decrease in the quantity of pizza supplied.
C) an increase in the supply of pizza.
D) a decrease in the supply of pizza.
E) a decrease in the supply of pizza and a simultaneous decrease in the quantity of pizza supplied.
Correct Answer:

Verified
Correct Answer:
Verified
Q16: Which of the following is true regarding
Q49: <img src="https://d2lvgg3v3hfg70.cloudfront.net/TB1458/.jpg" alt=" -The graph illustrates
Q62: <img src="https://d2lvgg3v3hfg70.cloudfront.net/TB1458/.jpg" alt=" -The above figures
Q76: Hot dogs and hot dog buns are
Q140: The quantity supplied of a good,service,or resource
Q267: <img src="https://d2lvgg3v3hfg70.cloudfront.net/TB1458/.jpg" alt=" -Which figure above
Q294: Mulch is shredded wood and is a
Q309: There are five hundred buyers in the
Q318: Suppose the equilibrium price of movie tickets
Q371: When does a surplus occur?