Essay
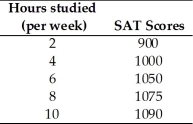
-Jamie is preparing to take his SAT tests.The table above shows how Jamie's score depends on the number of hours a week Jamie studies
a.Plot the relationship in the figure,putting the hours studied on the horizontal axis. 
b.Is the relationship you plotted positive or negative?
c.What happens to the slope of the relationship as hours studied increase?
d.Suppose Jamie can enroll in an SAT prep course and,by so doing,for every possible number of hours he studies,his score will be 100 points higher.Plot the new relationship between the number of hours studied and Jamie's SAT score in the figure.
e.How many variables are involved in the figure you just completed?
Correct Answer:

Verified
 a.The figure above plots the relationsh...
View Answer
Unlock this answer now
Get Access to more Verified Answers free of charge
Correct Answer:
Verified
View Answer
Unlock this answer now
Get Access to more Verified Answers free of charge
Q59: A graph shows the average SAT scores
Q124: Most economic graphs have two lines perpendicular
Q217: Which of the following statements is correct?<br>A)
Q251: <img src="https://d2lvgg3v3hfg70.cloudfront.net/TB1458/.jpg" alt=" -The figure above
Q292: As part of its proposal to win
Q294: We are investigating the relationship among three
Q302: Which of the following statements is a
Q304: Opportunity cost is best defined as<br>A) how
Q343: Wichita is building a convention center and
Q390: "It is impossible to represent a three