Multiple Choice
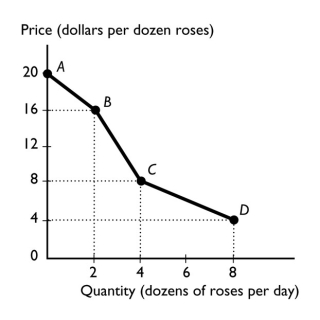
-The figure above shows the relationship between the price of a dozen roses and the quantity of roses a florist can sell.The slope between points B and C equals
A) 16.
B) 8.
C) 4.
D) 2.
E) 14.
Correct Answer:

Verified
Correct Answer:
Verified
Q246: <img src="https://d2lvgg3v3hfg70.cloudfront.net/TB1458/.jpg" alt=" -The figure above
Q247: The benefit from a good or service
Q248: Your economics professor offers 10 points extra
Q249: Suppose you take a trip during spring
Q250: <img src="https://d2lvgg3v3hfg70.cloudfront.net/TB1458/.jpg" alt=" -What is the
Q252: A curve with a positive but decreasing
Q253: If the quantity of the variable on
Q254: Which of the following statements is the
Q255: Which of the following is an example
Q256: When analyzing graphically the relationship between more