Multiple Choice
Use the graph below to answer the question(s) . 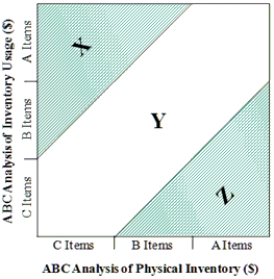
-In the ABC Inventory Matrix,inventory in area Y suggests
A) under-stocked A and B items.
B) under-stocked B and C items.
C) overstocked A and B items.
D) over-stocked B and C items.
E) inventory matches sales.
Correct Answer:

Verified
Correct Answer:
Verified
Related Questions
Q2: When demand and lead time are constant,reorder
Q3: When demand and delivery lead time are
Q4: Which of the following is not an
Q5: The (s,S)continuous review inventory system orders the
Q6: What inventory factor may be omitted from
Q7: The total annual inventory cost is the
Q8: The EOQ,also known as the economic order
Q9: The term Cycle Counting is synonymous with
Q10: The primary purpose of the basic economic
Q11: Dependent demand and independent demand items differ