Multiple Choice
Figure 7-1
Use the graph below to answer the question(s) . 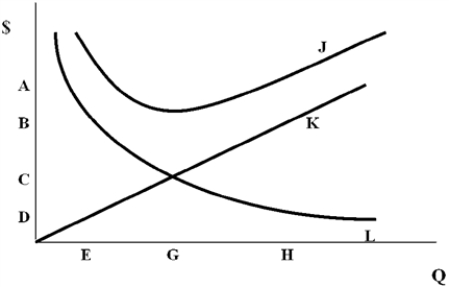
-Which of the following is TRUE in relation to Figure 7-1?
A) Curve J represents the annual ordering cost,and curve K represents the annual holding cost.
B) A lot size of G has an annual total cost of about C.
C) At lot size H both holding costs and ordering costs exceed the annual total cost.
D) The EOQ is most likely lot size G,and curve L is the annual ordering cost curve.
Correct Answer:

Verified
Correct Answer:
Verified
Q34: Use this information below to calculate the
Q35: Which of the following is not an
Q36: The EOQ model with quantity discounts attempts
Q37: An RFID reader does not require direct
Q38: The ABC inventory matrix shows an ABC
Q39: Companies hold a supply of inventory for
Q40: Inventory turnover ratio shows how many times
Q41: Dependent Demand must be forecasted based on
Q42: Service parts sold to the repair shops
Q43: In the Economic Manufacturing Quantity model,the annual