True/False
Because most data values are on the left,we would say that this dot plot (burglary rates per 100,000 persons in 350 U.S.cities)shows a distribution that is skewed to the left (negatively skewed). 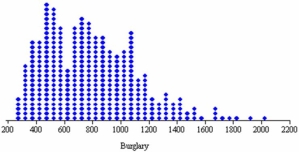
Correct Answer:

Verified
Correct Answer:
Verified
Related Questions
Q8: Which is not a characteristic of using
Q8: Excel's pyramid chart is generally preferred to
Q10: This histogram shows Chris's golf scores in
Q15: Briefly list strengths and weaknesses of this
Q17: Below is a sorted stem-and-leaf diagram for
Q18: Below is a frequency distribution of earnings
Q29: Which is a reason for using a
Q34: Effective summary tables generally:<br>A)have very detailed column
Q38: Stacked dot plots are useful in understanding
Q80: Which of the following is least useful