Essay
Briefly list strengths and weaknesses of this display.Cite specific principles of good graphs,as well as offering your own general interpretation. 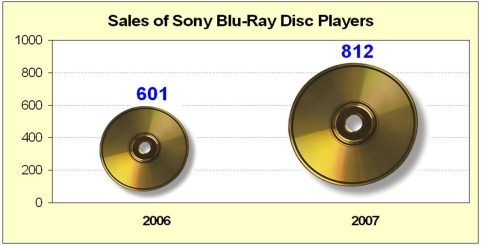
Correct Answer:

Verified
No source,no units given,area trick dist...View Answer
Unlock this answer now
Get Access to more Verified Answers free of charge
Correct Answer:
Verified
View Answer
Unlock this answer now
Get Access to more Verified Answers free of charge
Q8: Which is not a characteristic of using
Q10: This histogram shows Chris's golf scores in
Q13: Because most data values are on the
Q17: Below is a sorted stem-and-leaf diagram for
Q18: Below is a frequency distribution of earnings
Q19: Below is a sorted stem-and-leaf diagram for
Q34: Effective summary tables generally:<br>A)have very detailed column
Q38: Stacked dot plots are useful in understanding
Q70: Which is not a poor graphing technique?<br>A)Gratuitous
Q80: Which of the following is least useful