Multiple Choice
Below is a sorted stem-and-leaf diagram for the measured speeds (miles per hour) of 49 randomly chosen vehicles on highway I-80 in Nebraska.What is the mode? 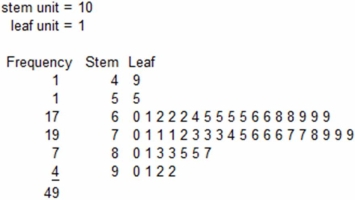
A) 62
B) 79
C) 65
D) Impossible to tell
Correct Answer:

Verified
Correct Answer:
Verified
Q15: Briefly list strengths and weaknesses of this
Q17: Below is a sorted stem-and-leaf diagram for
Q18: Below is a frequency distribution of earnings
Q19: The Pareto chart is used to display
Q23: Briefly list strengths and weaknesses of this
Q24: Craig operates a part-time snow-plowing business using
Q34: Effective summary tables generally:<br>A)have very detailed column
Q44: Histograms generally do not reveal the:<br>A)exact data
Q70: Which is not a poor graphing technique?<br>A)Gratuitous
Q80: Which of the following is least useful