Multiple Choice
Table 6.1
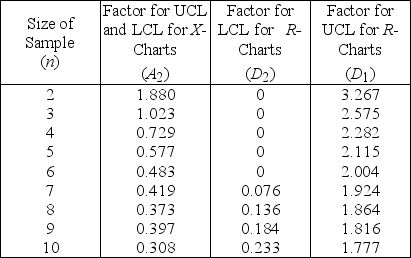
Factors for Calculating Three-Sigma Limits for the  -chart and R-chart
 Source: 1950 Manual on Quality Control of Materials,copyright
American Society for Testing Materials.Reprinted with permission.
-A milling operation has historically produced an average thickness of 0.005 inch with an average range of 0.0015 inch.Currently,the first three items from each batch of 20 are inspected.Use Table 6.1.What is the value of the UCL  ?
?
A) less than or equal to 0.00200
B) greater than 0.00200 but less than or equal to 0.00399
C) greater than 0.00399 but less than or equal to 0.00599
D) greater than 0.00599
Correct Answer:

Verified
Correct Answer:
Verified
Q29: The cause-and-effect diagram is a method that<br>A)
Q29: For a high- technology product, the lifespan
Q31: Benchmarking is a continuous, systematic procedure that
Q49: Which of the quality "gurus" advocated the
Q72: Stable product and service designs help to
Q89: Customers define quality in many ways.
Q101: When should complete inspection be used?<br>A) when
Q107: A company is interested in monitoring the
Q203: Statistical process control (SPC) uses statistical methods
Q214: _ refers to how well the product