Multiple Choice
The graph below shows how yield in two varieties of corn respond to different environmental conditions.Which statement below is TRUE? 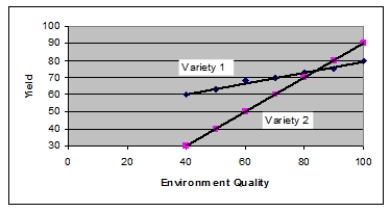
A) Under tested conditions, variety 1 has a higher yield than variety 2.
B) Under tested conditions, variety 2 has a higher yield than variety 1.
C) Under tested conditions, variety 2 is more sensitive to environment quality than variety 1.
D) Variety 1 is genetically superior to variety 2.
E) Variety 2 is genetically superior to variety 1.
Correct Answer:

Verified
Correct Answer:
Verified
Q2: Realized heritability experiments were conducted on three
Q6: Which of the following statements about heritability
Q8: Which of the following traits is likely
Q9: A population may eventually stop responding to
Q10: Narrow-sense heritability of height in humans was
Q11: A series of experiments shows that oil
Q35: Phenotypic variation in a trait is often
Q56: _ is a way to measure the
Q63: _ can cause a single genotype to
Q80: You and a close friend from the