Multiple Choice
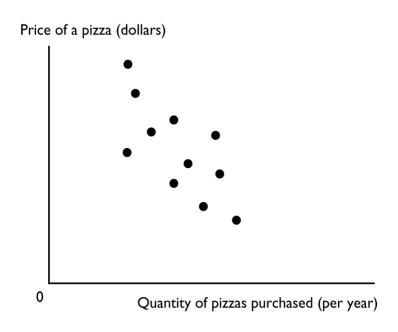
-The figure above shows a
A) time-series graph.
B) scatter diagram.
C) cross-section graph.
D) slope.
E) trend diagram.
Correct Answer:

Verified
Correct Answer:
Verified
Related Questions
Q241: Shaniq can spend the next hour studying
Q242: To make a rational choice,a person<br>A) compares
Q243: To graph a relationship among several variables,we
Q244: Which of the following is true?<br>i.A rational
Q245: The primary focus of microeconomics is<br>A) to
Q247: The benefit from a good or service
Q248: Your economics professor offers 10 points extra
Q249: Suppose you take a trip during spring
Q250: <img src="https://d2lvgg3v3hfg70.cloudfront.net/TB1458/.jpg" alt=" -What is the
Q251: <img src="https://d2lvgg3v3hfg70.cloudfront.net/TB1458/.jpg" alt=" -The figure above