Multiple Choice
-A graph of the relationship between two variables is a line that slopes down to the right.These two variables are ________ related.
A) positively
B) directly
C) negatively
D) not
E) trend-line
Correct Answer:

Verified
Correct Answer:
Verified
Q73: You have data for sales of pizza
Q74: Economists measure opportunity cost<br>A) only when it
Q75: A positive statement<br>i.makes a statement about how
Q76: Scarcity means we must<br>A) consume less.<br>B) produce
Q77: When a home builder decides to computerize
Q79: A time series graph reveals whether there
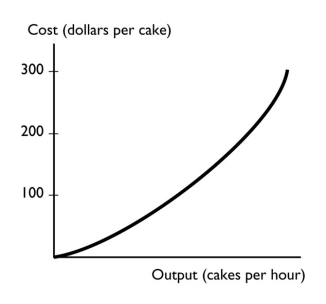
Q81: <img src="https://d2lvgg3v3hfg70.cloudfront.net/TB1458/.jpg" alt=" -The figure above
Q82: In making your decision whether to take
Q391: <img src="https://d2lvgg3v3hfg70.cloudfront.net/TB8586/.jpg" alt=" -A graph has
Q421: <img src="https://d2lvgg3v3hfg70.cloudfront.net/TB8586/.jpg" alt=" -The figure above