Multiple Choice
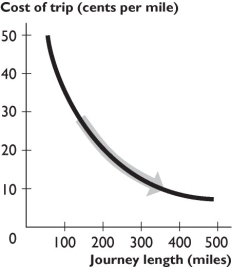
-The figure above shows the relationship between the journey length and the cost of trip per mile.The curve becomes flatter because as the journey length increases,
A) the fall in the cost per mile becomes smaller.
B) the fall in the cost per mile becomes greater.
C) the cost per mile decreases.
D) the cost per mile increases.
E) the cost per mile remains unchanged.
Correct Answer:

Verified
Correct Answer:
Verified
Q76: Scarcity means we must<br>A) consume less.<br>B) produce
Q77: When a home builder decides to computerize
Q78: <img src="https://d2lvgg3v3hfg70.cloudfront.net/TB1458/.jpg" alt=" -A graph of
Q79: A time series graph reveals whether there
Q82: In making your decision whether to take
Q84: List and explain the three fundamental economic
Q85: An opportunity cost is<br>A) the dollar amount
Q300: Why do economists say that even very
Q391: <img src="https://d2lvgg3v3hfg70.cloudfront.net/TB8586/.jpg" alt=" -A graph has
Q421: <img src="https://d2lvgg3v3hfg70.cloudfront.net/TB8586/.jpg" alt=" -The figure above