Multiple Choice
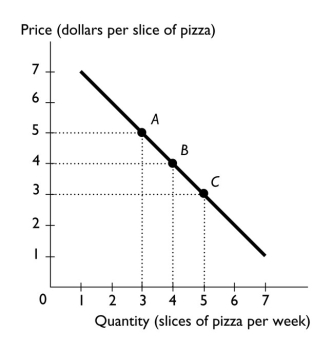
-The above figure shows the relationship between the price of a slice of pizza and how many slices of pizza Ricardo buys in a week.Between points A and B,the slope of the line is ________ the slope of the line between points B and C.
A) greater than
B) equal to
C) less than
D) unrelated to
E) not comparable to
Correct Answer:

Verified
Correct Answer:
Verified
Q231: <img src="https://d2lvgg3v3hfg70.cloudfront.net/TB1458/.jpg" alt=" -The figure above
Q232: <img src="https://d2lvgg3v3hfg70.cloudfront.net/TB1458/.jpg" alt=" -In the figure
Q233: John has two hours of free time
Q234: Moving rightward along a straight line,the slope
Q235: An independent relationship between two variables is
Q237: <img src="https://d2lvgg3v3hfg70.cloudfront.net/TB1458/.jpg" alt=" -In the figure
Q238: Trend refers to<br>A) the scale used on
Q239: When two variables in a graph are
Q241: Shaniq can spend the next hour studying
Q401: What is a normative statement? Give an