Multiple Choice
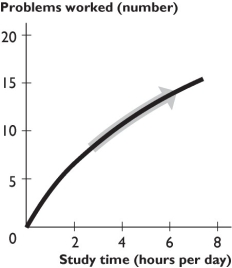
-The figure above shows the relationship between study time and the number of problems worked.The curve becomes less steep because as you study more,
A) study time becomes less effective.
B) study time becomes more effective.
C) the number of problems worked increases.
D) the number of problems worked decreases.
E) the relationship between study time and the number of problems worked changes from direct to inverse.
Correct Answer:

Verified
Correct Answer:
Verified
Q226: Which of the following is an example
Q227: The slope<br>A) of a straight line is
Q228: If a curve rises and then falls,it
Q229: Which of the following is a microeconomic
Q232: <img src="https://d2lvgg3v3hfg70.cloudfront.net/TB1458/.jpg" alt=" -In the figure
Q233: John has two hours of free time
Q234: Moving rightward along a straight line,the slope
Q235: An independent relationship between two variables is
Q236: <img src="https://d2lvgg3v3hfg70.cloudfront.net/TB1458/.jpg" alt=" -The above figure
Q237: A graph of two variables is a