Multiple Choice
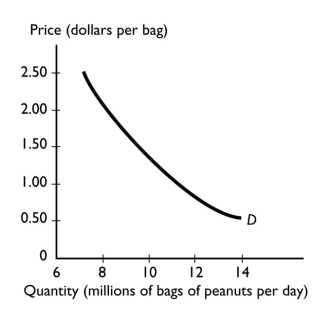
-The graph illustrates the demand for peanuts.Peanuts are a normal good because the
A) demand curve for peanuts slopes downward.
B) demand for peanuts increases when income increases.
C) demand for peanuts increases when the price of one of its substitutes rises.
D) peanuts have both substitutes and complements.
E) demand curve shows that if the price of peanuts rises, there is a movement along the demand curve to a lower quantity demanded.
Correct Answer:

Verified
Correct Answer:
Verified
Q110: Which of the following leads to an
Q111: A competitive market is in equilibrium.Then there
Q112: During 2008 the supply of gasoline decreased
Q113: If the number of sellers decreases,then the
Q114: The law of supply states that other
Q116: Suppose that the equilibrium price and quantity
Q117: <img src="https://d2lvgg3v3hfg70.cloudfront.net/TB1458/.jpg" alt=" -The graph illustrates
Q118: <img src="https://d2lvgg3v3hfg70.cloudfront.net/TB1458/.jpg" alt=" -The above figures
Q119: Consider the market for smart phones.Which of
Q120: Which of the following is correct?<br>i.A surplus