Multiple Choice
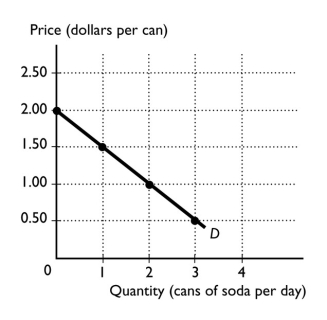
-The graph illustrates the demand curve for soda.After a rise in the price of a soda from $1.00 a can to $2.00 a can,the quantity of soda demanded
A) decreases from 2 cans to 0 cans a day.
B) increases from 0 cans to 2 cans a day.
C) remains unchanged.
D) decreases from 1 can to 0 cans a day.
E) cannot be determined from the figure because the demand curve will shift to a new curve.
Correct Answer:

Verified
Correct Answer:
Verified
Q112: During 2008 the supply of gasoline decreased
Q113: If the number of sellers decreases,then the
Q114: The law of supply states that other
Q115: <img src="https://d2lvgg3v3hfg70.cloudfront.net/TB1458/.jpg" alt=" -The graph illustrates
Q116: Suppose that the equilibrium price and quantity
Q118: <img src="https://d2lvgg3v3hfg70.cloudfront.net/TB1458/.jpg" alt=" -The above figures
Q119: Consider the market for smart phones.Which of
Q120: Which of the following is correct?<br>i.A surplus
Q121: When demand increases,<br>A) consumers are willing to
Q122: Plywood is used in the construction of