Multiple Choice
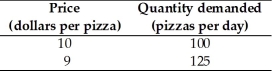
-The data in the table above give two points on the demand curve for pizza.Using the midpoint method,when the price of a pizza falls from $10 to $9,what is the price elasticity of demand?
A) 0.5
B) 0.6
C) 0.9
D) 2.1
E) 8.6
Correct Answer:

Verified
Correct Answer:
Verified
Q121: When the price of bananas rises 2
Q126: If a good has only a few,poor
Q127: The price elasticity of demand is a
Q129: Suppose a 20 percent increase in the
Q130: Which of the following statements is correct?<br>A)
Q132: <img src="https://d2lvgg3v3hfg70.cloudfront.net/TB1458/.jpg" alt=" -The demand curve
Q134: If a lower price for a Pepsi
Q135: If the demand for a good is
Q136: Suppose the Chicago Bears football team raises
Q192: <img src="https://d2lvgg3v3hfg70.cloudfront.net/TB8586/.jpg" alt=" -The table above