Multiple Choice
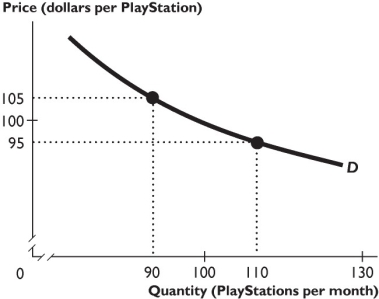
-The demand curve shown in the figure above is ________ over the price range from $95 to $105 per unit.
A) perfectly elastic
B) perfectly inelastic
C) unit elastic
D) elastic but not perfectly elastic
E) inelastic but not perfectly inelastic
Correct Answer:

Verified
Correct Answer:
Verified
Q121: When the price of bananas rises 2
Q127: The price elasticity of demand is a
Q129: Suppose a 20 percent increase in the
Q130: Which of the following statements is correct?<br>A)
Q131: <img src="https://d2lvgg3v3hfg70.cloudfront.net/TB1458/.jpg" alt=" -The data in
Q134: If a lower price for a Pepsi
Q135: If the demand for a good is
Q136: Suppose the Chicago Bears football team raises
Q137: If the cross elasticity of demand between
Q192: <img src="https://d2lvgg3v3hfg70.cloudfront.net/TB8586/.jpg" alt=" -The table above