Multiple Choice
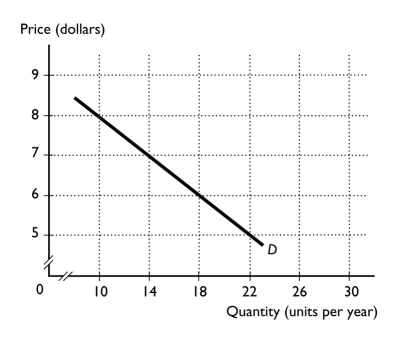
-In the figure above,using the midpoint method,the price elasticity of demand when the price falls from $6 to $5 is equal to
A) 2.50.
B) 1.63.
C) 1.10.
D) 0.91.
E) 1.00.
Correct Answer:

Verified
Correct Answer:
Verified
Q148: <img src="https://d2lvgg3v3hfg70.cloudfront.net/TB1458/.jpg" alt=" -Using the data
Q149: Which of the following is most likely
Q150: If the price of a a good
Q151: <img src="https://d2lvgg3v3hfg70.cloudfront.net/TB1458/.jpg" alt=" -Using the data
Q152: Suppose an increase in demand causes the
Q154: If the price elasticity of demand for
Q155: <img src="https://d2lvgg3v3hfg70.cloudfront.net/TB1458/.jpg" alt=" The figure
Q156: If the cross elasticity of demand is
Q157: If a firm supplies 200 units at
Q519: <img src="https://d2lvgg3v3hfg70.cloudfront.net/TB8586/.jpg" alt=" -In the figure