Multiple Choice
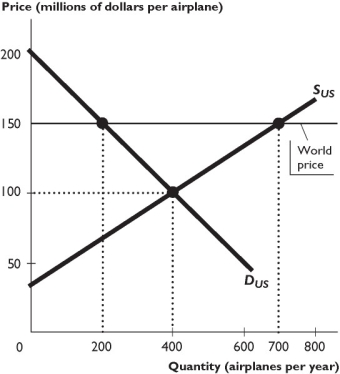
The figure above shows the U.S. market for airplanes, where SUS is the domestic supply curve and DUS is the domestic demand curve. The United States trades freely with the rest of the world. The world price of an airplane is $150 million.
-In the figure above,U.S.consumers buy ________ airplanes per year at ________ million per airplane.
A) 200; $150
B) 400; $100
C) 700; $150
D) 400; $150
E) 200; $100
Correct Answer:

Verified
Correct Answer:
Verified
Q44: Currently, the United States has a quota
Q130: <img src="https://d2lvgg3v3hfg70.cloudfront.net/TB1458/.jpg" alt=" -The above figure
Q132: What is the infant-industry argument for protection
Q133: <img src="https://d2lvgg3v3hfg70.cloudfront.net/TB1458/.jpg" alt=" The figure
Q134: <img src="https://d2lvgg3v3hfg70.cloudfront.net/TB1458/.jpg" alt=" -The above figure
Q136: If the United States imports purses,then the
Q137: What is the dumping argument for protection
Q138: The difference between a tariff and a
Q139: When a nation exports a good,its _
Q140: During the past 70 years,the peak average