Multiple Choice
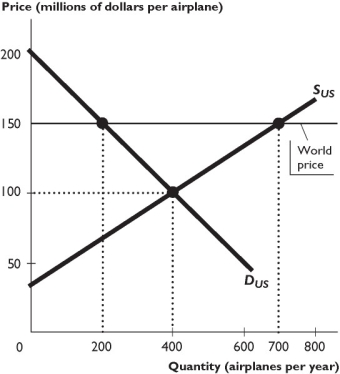
The figure above shows the U.S. market for airplanes, where SUS is the domestic supply curve and DUS is the domestic demand curve. The United States trades freely with the rest of the world. The world price of an airplane is $150 million.
-Based on the figure above,international trade leads to
A) a net gain in surplus of $12.5 billion.
B) a net loss of surplus of $12.5 billion.
C) a net gain in surplus of $27.5 billion.
D) a net loss of surplus of $15 billion.
E) no net gain or loss of surplus.
Correct Answer:

Verified
Correct Answer:
Verified
Q44: Currently, the United States has a quota
Q128: After NAFTA was signed,the United States allowed
Q129: How do imports affect sellers' producer surplus?
Q130: <img src="https://d2lvgg3v3hfg70.cloudfront.net/TB1458/.jpg" alt=" -The above figure
Q132: What is the infant-industry argument for protection
Q134: <img src="https://d2lvgg3v3hfg70.cloudfront.net/TB1458/.jpg" alt=" -The above figure
Q135: <img src="https://d2lvgg3v3hfg70.cloudfront.net/TB1458/.jpg" alt=" The figure
Q136: If the United States imports purses,then the
Q137: What is the dumping argument for protection
Q138: The difference between a tariff and a