Multiple Choice
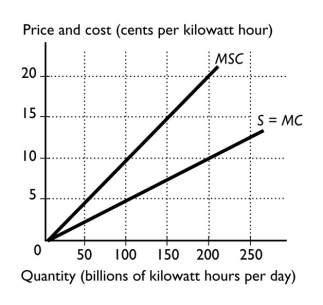
-The figure above shows the marginal social cost curve of generating electricity and the marginal private cost curve.The difference between the marginal cost curve and the marginal social cost curve equals
A) marginal private cost.
B) private cost.
C) external cost.
D) marginal external cost.
E) Coasian cost.
Correct Answer:

Verified
Correct Answer:
Verified
Q132: If the production of a good creates
Q150: Which of the following is an example
Q152: <img src="https://d2lvgg3v3hfg70.cloudfront.net/TB1458/.jpg" alt=" -The figure above
Q153: <img src="https://d2lvgg3v3hfg70.cloudfront.net/TB1458/.jpg" alt=" -The figure above
Q154: <img src="https://d2lvgg3v3hfg70.cloudfront.net/TB1458/.jpg" alt=" -The figure above
Q156: What are marketable permits? Suppose there are
Q157: When the benefits of producing a good
Q158: Cap-and-trade refers to<br>A) capping emissions and issuing
Q159: <img src="https://d2lvgg3v3hfg70.cloudfront.net/TB1458/.jpg" alt=" -The figure above
Q160: <img src="https://d2lvgg3v3hfg70.cloudfront.net/TB1458/.jpg" alt=" -The figure above