Multiple Choice
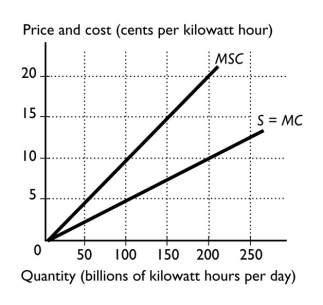
-The figure above shows the marginal social cost curve of generating electricity and the marginal private cost curve.The marginal cost paid by the producers and everyone else in society when 100 billion kilowatt hours are produced is
A) 0¢ per kilowatt.
B) 5¢ per kilowatt.
C) 10¢ per kilowatt.
D) 20¢ per kilowatt.
E) 15¢ per kilowatt.
Correct Answer:

Verified
Correct Answer:
Verified
Q132: If the production of a good creates
Q148: The Coase theorem says that if property
Q149: Which of the following are devices that
Q150: Which of the following is an example
Q152: <img src="https://d2lvgg3v3hfg70.cloudfront.net/TB1458/.jpg" alt=" -The figure above
Q154: <img src="https://d2lvgg3v3hfg70.cloudfront.net/TB1458/.jpg" alt=" -The figure above
Q155: <img src="https://d2lvgg3v3hfg70.cloudfront.net/TB1458/.jpg" alt=" -The figure above
Q156: What are marketable permits? Suppose there are
Q157: When the benefits of producing a good
Q158: Cap-and-trade refers to<br>A) capping emissions and issuing