Essay
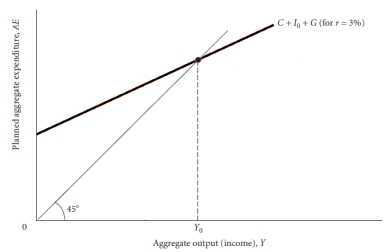 Figure 27.1
-Use Figure 27.1 above to answer the following question. Assume that the aggregate expenditure function depicted in the graph is based on an interest rate of 3%. Now assume that the interest rate rises to let's say 6%. Graphically illustrate the impact that this will have on the aggregate expenditure function and equilibrium output. Explain your answer.
Correct Answer:

Verified
An increase in the interest ra...View Answer
Unlock this answer now
Get Access to more Verified Answers free of charge
Correct Answer:
Verified
View Answer
Unlock this answer now
Get Access to more Verified Answers free of charge
Q90: Explain when fiscal policy is more effective
Q91: Explain the only circumstance in which expansionary
Q92: <img src="https://d2lvgg3v3hfg70.cloudfront.net/TB2925/.jpg" alt=" Table 27.1 -Use
Q93: Draw a planned investment curve as it
Q94: What will be the impact on money
Q95: How does monetary policy affect the goods
Q96: Describe the sequence of events that occurs
Q97: Explain why the effectiveness of an expansionary
Q98: In deriving a demand curve for an
Q99: What would be the policy mix that