Essay
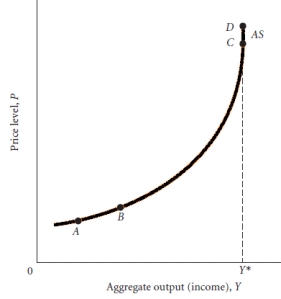 Figure 28.1
-Figure 28.1 depicts a short-run aggregate supply curve. Explain why it is shaped this way. Be very specific.
Correct Answer:

Verified
In the short run, the aggregate supply c...View Answer
Unlock this answer now
Get Access to more Verified Answers free of charge
Correct Answer:
Verified
View Answer
Unlock this answer now
Get Access to more Verified Answers free of charge
Q42: Aggregating the production of vastly disparate goods
Q43: Why will the price level tend to
Q44: <img src="https://d2lvgg3v3hfg70.cloudfront.net/TB2925/.jpg" alt=" -Using the graph
Q45: How do expectations impact inflation?
Q46: Define hyperinflation
Q47: Assuming a decline in money demand explains
Q48: <img src="https://d2lvgg3v3hfg70.cloudfront.net/TB2925/.jpg" alt=" -Using the above
Q49: <img src="https://d2lvgg3v3hfg70.cloudfront.net/TB2925/.jpg" alt=" Figure 28.1 -Consider
Q50: Assume the economy is operating in the
Q51: Discuss why the aggregate supply function is