Essay
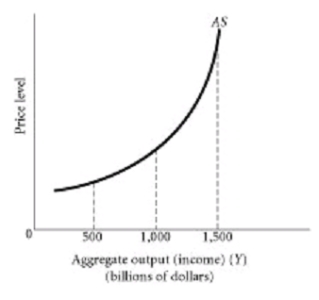
-Using the graph above, at aggregate output levels below $500 billion what is this economy likely experiencing?
Correct Answer:

Verified
It is likely experie...View Answer
Unlock this answer now
Get Access to more Verified Answers free of charge
Correct Answer:
Verified
View Answer
Unlock this answer now
Get Access to more Verified Answers free of charge
Q39: Explain cost-push inflation and give an example
Q40: Illustrate what happens to the aggregate supply
Q42: Aggregating the production of vastly disparate goods
Q43: Why will the price level tend to
Q45: How do expectations impact inflation?
Q46: Define hyperinflation
Q46: <img src="https://d2lvgg3v3hfg70.cloudfront.net/TB2925/.jpg" alt=" Figure 28.1 -Figure
Q47: Assuming a decline in money demand explains
Q48: <img src="https://d2lvgg3v3hfg70.cloudfront.net/TB2925/.jpg" alt=" -Using the above
Q49: <img src="https://d2lvgg3v3hfg70.cloudfront.net/TB2925/.jpg" alt=" Figure 28.1 -Consider